
Middle Tule Grove
Middle Tule Grove
Overview
Health & Resilience Summary
low
0.4
This grove is ranked Low for Relative Overall Vulnerability due to:
Wildfire Vulnerability
Low - 0.4
Regen Vulnerability
Low - 0.4
See the Grove Health & Resilience section below for more information.
low
0.4
This grove is ranked Low for Relative Management Priority due to:
Overall Vulnerability
Low - 0.4
Treatment Feasibility
Good - 9.2
See the Management Considerations section below for more information.
Grove Map
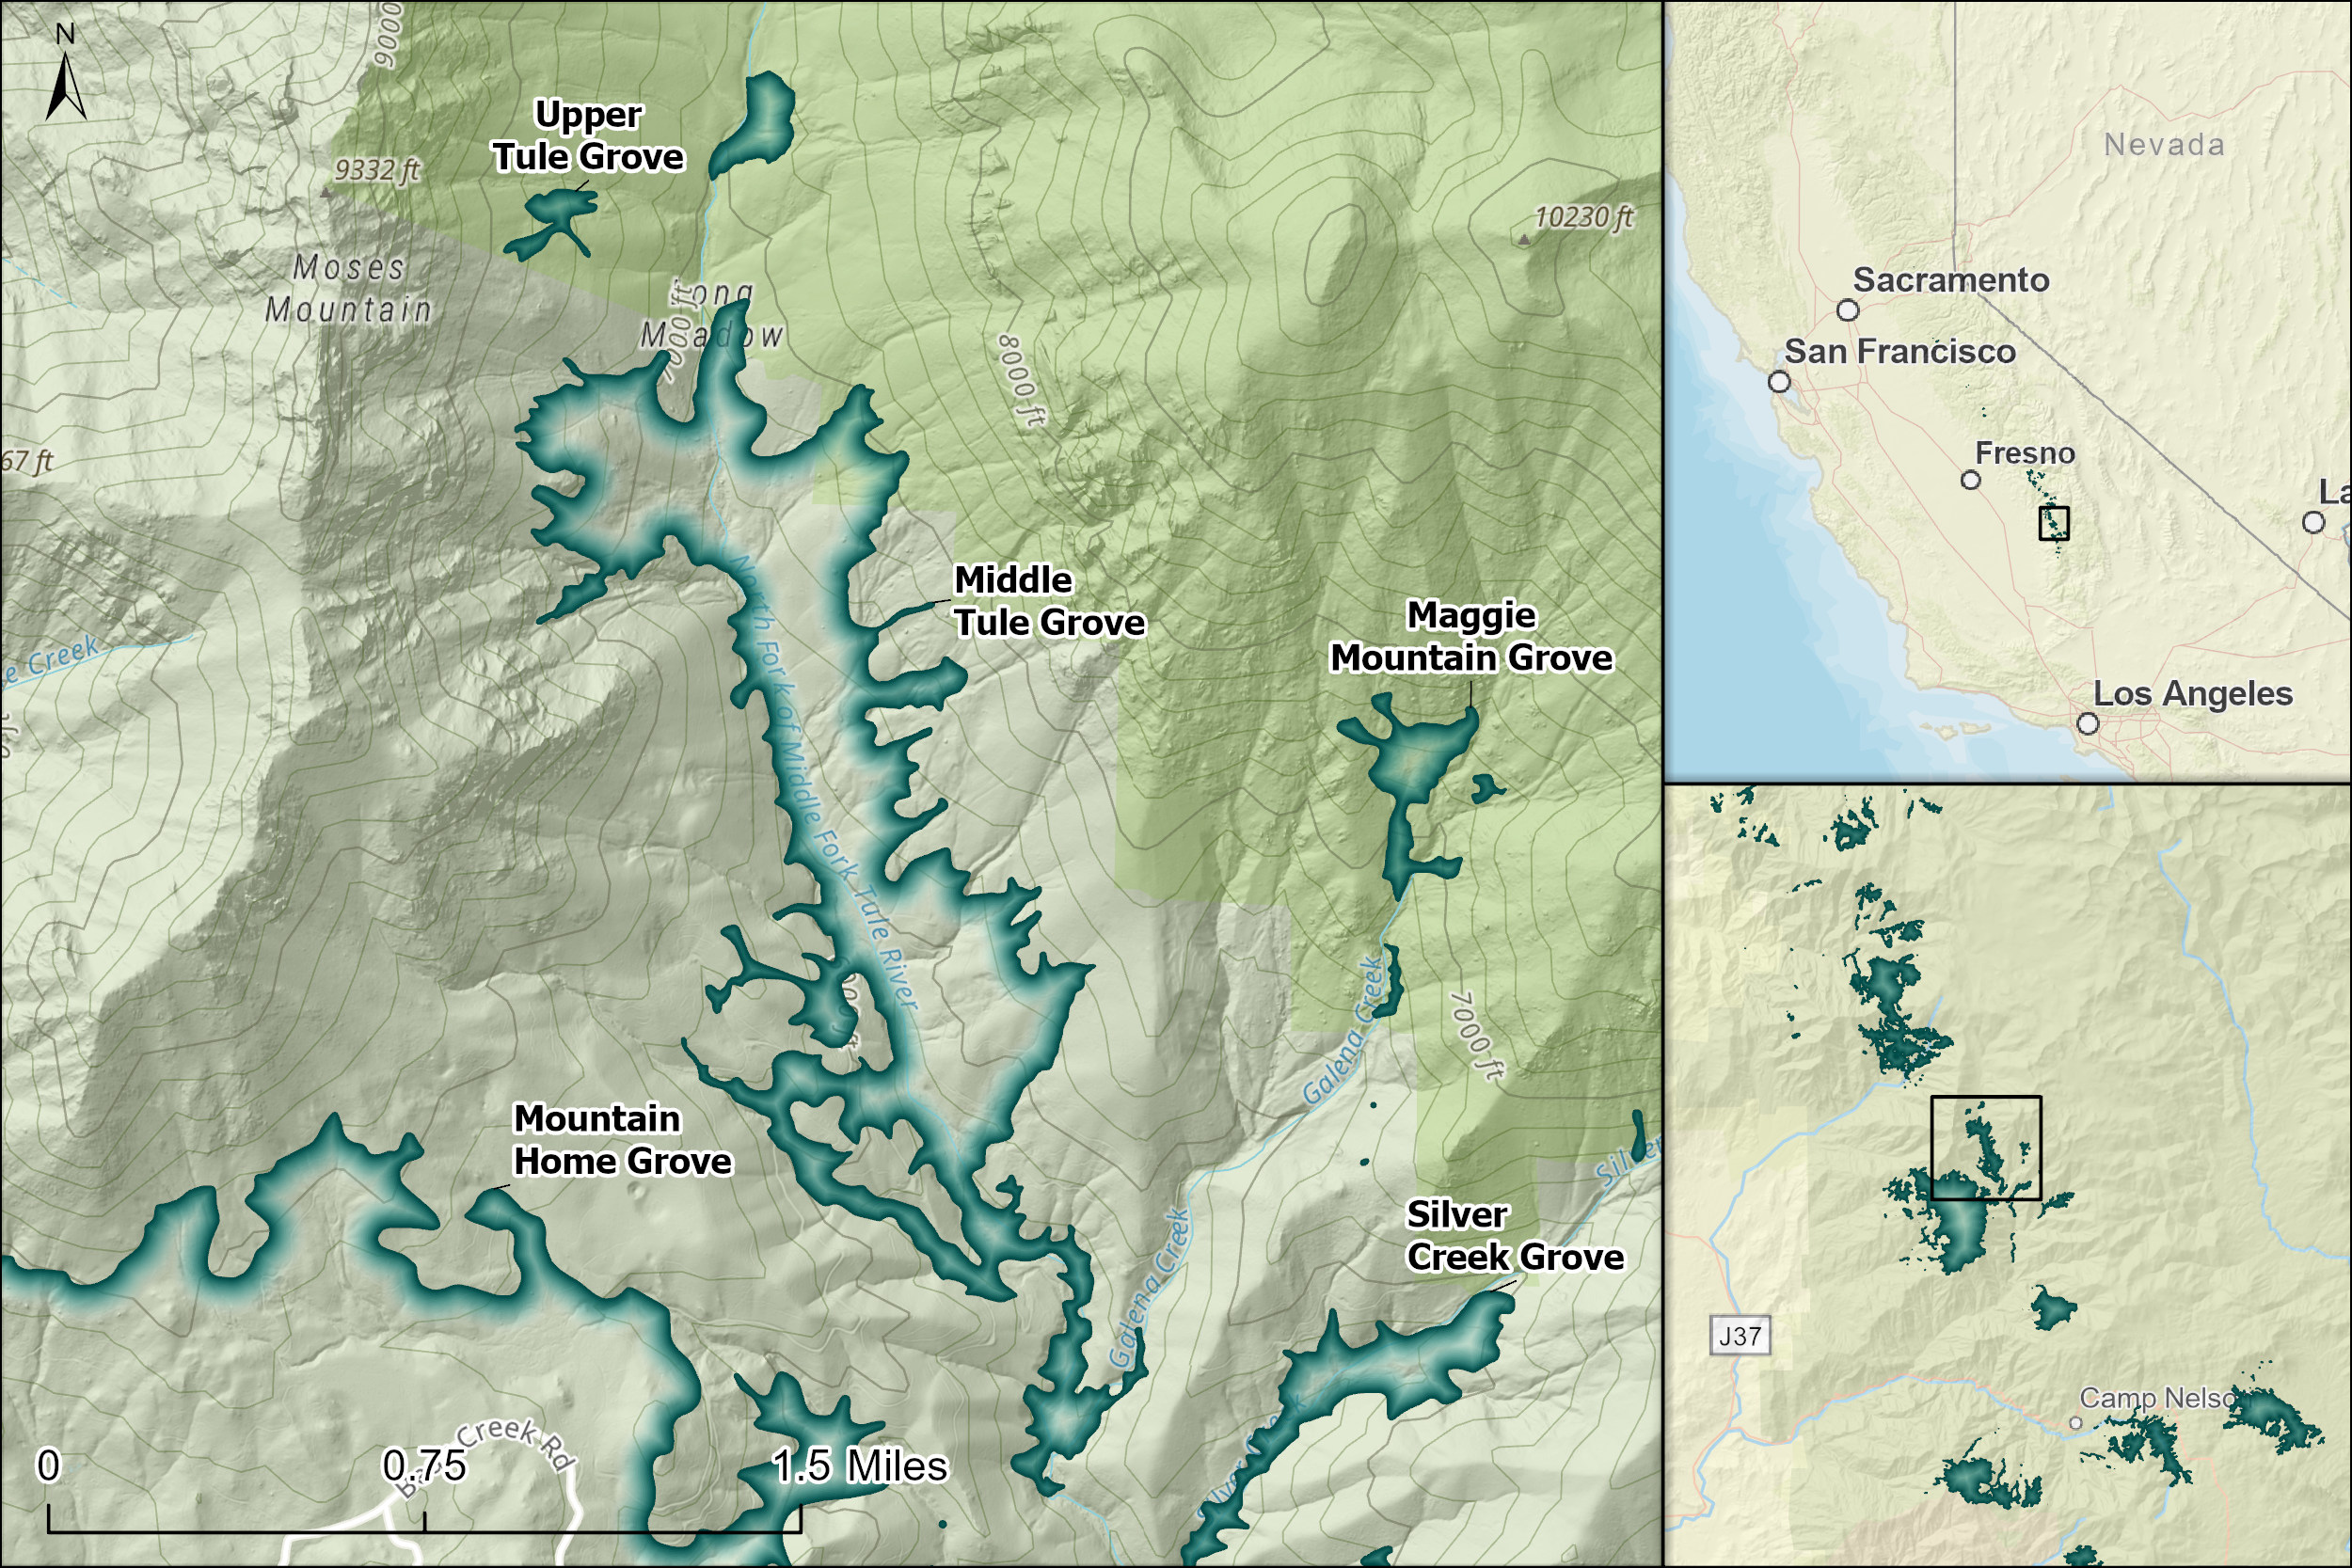
Grove Map - click map for more detailed spatial information
Grove Information
| Property | Value |
|---|---|
| Grove Size (Acres) | 481 |
| Location | Upper Tule Watershed, Tulare County |
| Management Unit(s) | Giant Sequoia National Monument / Sequoia National Forest, Mountain Home Demonstration State Forest |
| Land Steward(s) | Cal-Fire, USFS SQF GSNM |
About Middle Tule Grove
Middle Tule Grove is a 480-acre grove in the Tule and Kern River Watershed region situated between 5,256 - 7,609 feet elevation at 36.26097°N. It is located near the base of Moses Mountain along the North Fork of the Middle Fork of the Tule River. The grove is managed by Giant Sequoia National Monument/Sequoia National Forest. Middle Tule Grove has heavy recreational use in the portion of the grove that is west of the Wishon Fork.
Middle Tule Grove
Health & Resilience
Middle Tule Grove is ranked Low for Relative Overall Vulnerability because it is at a Low risk of being negatively impacted by the effects of severe wildfire and at Low risk for inadequate natural regeneration.
Additionally, Middle Tule Grove is at Low risk for negative impacts from drought stress, Medium levels of tree mortality have been detected in the grove, and the presence and activity of beetles in the grove is Confirmed. 98.1% of Middle Tule Grove has burned in large fires since 1984. See below for more detailed information.
low
0.4
Relative Overall Vulnerability
Relative Overall Vulnerability is based on Wildfire Vulnerability and Regeneration Vulnerability using an area-weighted calculation. See Grove Assessment Analysis Methods for more details.
The pie charts below provide the percentage of the grove with high, medium, and low vulnerabilities. Click on the charts to view interactive maps of these vulnerabilities within the grove.
Below is additional information about Middle Tule Grove's Health & Resilience. These data, their inputs, and any available notes and updates may be found in the Grove Resilience Datasheet.
Beetle Activity
Beetle Activity in Middle Tule Grove has been confirmed by a survey.
Please see the Grove Resilience Datasheet for details.
Drought-related Tree Mortality (all species)
The drought- and insect-related mortality of all tree species combined in Middle Tule Grove is estimated as Medium according to USFS dead canopy surveys from 2017-2021. Please see Grove Assessment Analysis Methods for details.
The table below provides information about large wildfires in this grove recorded since 1984. See this map of wildfires and locations of high severity fire.
| Metric | Value |
|---|---|
| Wildfires | CASTLE - 2020, ALDER - 2018, HIDDEN - 2016 |
| % of grove burned | 98.1% |
| % of grove unburned | 1.9% |
| Fire Return Interval Departure | High |
The chart below provides the percentages of the grove burned at different levels of severity for each wildfire since 1984.
Middle Tule Grove
Management Considerations
Middle Tule Grove is ranked Low for Relative Management Priority because it has Low Relative Overall Vulnerability and Good feasibility for implementing management actions toward restoration goals.
Additionally, the grove is 3.5 miles from a community and is 2.2 miles from recreational infrastructure. Heavy outdoor recreation use in a portion of the grove. See below for more detailed information.
low
0.4
Relative Management Priority
Relative Management Priority is determined by combining the Relative Overall Vulnerability and Treatment Feasibility ranks. See Grove Assessment Analysis Methods for more details.
Relative Overall Vulnerability
Low - 0.4
See the Health & Resilience section above for the component metrics for the Relative Overall Vulnerability rank.
Treatment Feasibility
good - 9.2
| Factor | Value |
|---|---|
| Special Land Designation | Golden Trout Wilderness |
| Grove Manager Opinion | Fuel Treatments are Possible |
| Remote | No |
Below is additional information relevant to Middle Tule Grove's Management Considerations. These data, their inputs, and any available notes and updates may be found in the Grove Resilience Datasheet.
Treatment History
The table below lists treatment projects in and 90 meters around this grove implemented since 2022. See this map of grove treatments.
| Treatment Type | % of Grove | Acres |
|---|---|---|
| Mechanical Treatments | 5% | 47.7 |
| Prescribed Fire | 4.2% | 40.2 |
| Pile Treatments | 0% | 0 |
| Pile Burns | 0% | 0 |
| Replanting | 0% | 0 |
Management Recommendations
The table below provides an estimate of the percentage and acreage of the grove that are recommended for evaluation for treatment based on the Vulnerability Models. See this map of Grove Vulnerability Models.
| Treatment Need | % of Grove | Acres |
|---|---|---|
| Fuels Reduction/Restoration | 1.1% | 5.291 |
| Reforestation | 3.5% | 16.835 |
Middle Tule Grove
References
- Willard, D. 1994. Giant Sequoia Groves of the Sierra Nevada: A Reference Guide.
- Giant Sequoia Health & Resilience Assessment Glossary
- How to Use the Giant Sequoia Health & Resilience Assessment
- Giant Sequoia Health & Resilience Assessment Analysis Methods
Find more giant sequoia science by searching the GSLC Scientific Publications Library.
Explore more groves or learn about the Giant Sequoia Lands Coalition.
Disclaimer
The information presented in the Giant Sequoia Grove Health & Resilience Assessment is intended to supplement on-the-ground knowledge of giant sequoia groves for use in conjunction with current on-the-ground knowledge of grove condition and management activities when planning fuel treatment and reforestation projects. It should not be considered the only source of information about the condition of groves.